Scilab Code:
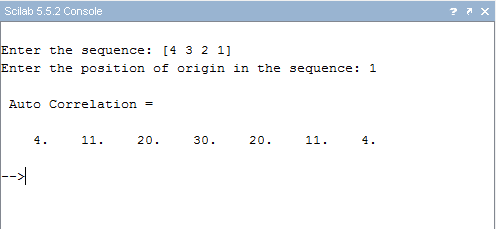
//Cross-correlation of x(n) and h(n) is:
//R(k) = summation of x(n).h(n-k) for n = -INF to
INF
//Positions of origin in given sequences don't
matter,
//they're taken only for plotting the given
sequences.
clc; clear; close;
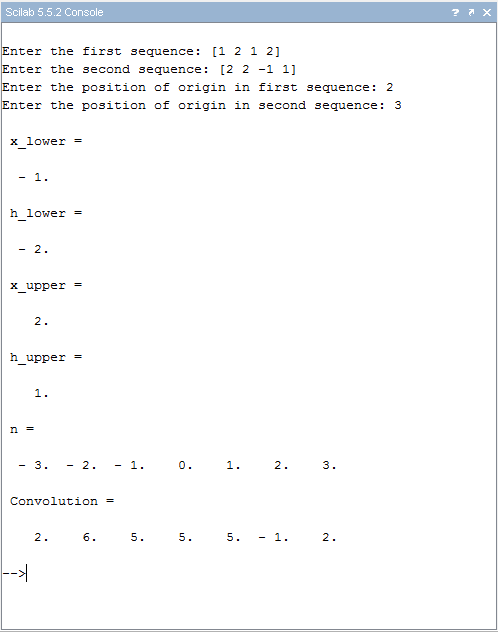
x =
input("Enter First Sequence: ");
h =
input("Enter Second Sequence: ");
x_origin = input("Enter the
origin position in first sequence: ");
h_origin = input("Enter the
origin position in second sequence: ");
x_upper = length(x) - x_origin;
h_upper = length(h) - h_origin;
x_lower = -(x_origin - 1);
h_lower = -(h_origin - 1);
//Plot x(n)
subplot(3,1, 1);
n =
x_lower : x_upper;
plot2d3(n, x, style=color("red"));
xtitle("x(n)","n");
a =
gca();
a.x_location = "origin";
a.y_location = "origin";
a.children.children(1).thickness = 2;
//Plot h(n)
subplot(3,1, 2);
n =
h_lower : h_upper;
plot2d3(n, h, style=color("green"));
xtitle("h(n)","n");
a =
gca();
a.x_location = "origin";
a.y_location = "origin";
a.children.children(1).thickness = 2;
//Plot the cross correlation
subplot(3,1, 3);
[y, ind]
= xcorr(x, h);
disp(y, "Cross correlation = ");
plot2d3(ind, y, style=color("blue"));
a =
gca();
a.y_location = "origin";
xtitle("Cross
Correlation of x(n) and h(n)","n","R(k)");
a.children.children(1).thickness = 2;
Console I/O:
Plot: